AI-Powered Marketing Analytics & Data Visualization Program
Looking for a Marketing Analytics & Data Visualization Course in Ludhiana?
✅ Learn Excel, Tableau, and Looker Studio with AI-enhanced analytics
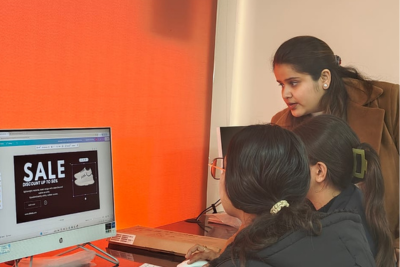
✅ Work on real business data & hands-on projects
✅ Ideal for marketing professionals, analysts & freshers
✅ Industry certification | Live training | Practical application
3 Months
75,000


Request a Free Career Consultation
Confused? Talk to Our Experts
Marketing Analytics & Data Visualization Program Curriculum (3 Months)
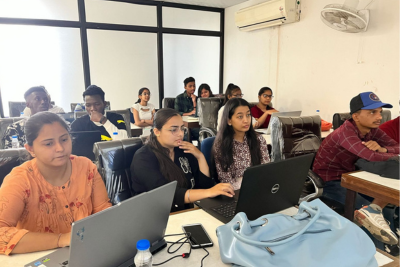
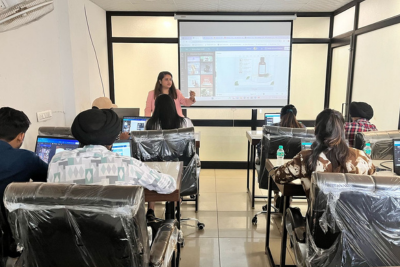
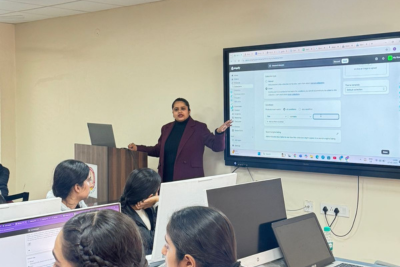
100% Practical Training | Hands-on Experience with Live Projects
-
01
Introduction to Marketing Analytics
• Overview of marketing analytics and data-driven decisions
• Importance of tracking marketing performance
• Key marketing metrics: ROI, ROAS, CAC, CLV, CTR, etc.
• Tools overview: Excel, Google Analytics, Tableau, Google Looker Studio -
02
Data Collection & Preparation (Weeks 2-3)
• Data collection from Google Analytics, Facebook Ads, CRM, Shopify
• Importing data from CSVs, APIs, and databases
• Data cleaning & transformation in Excel ,Tableau
• Preparing data for analysis and visualization -
03
Exploratory Data Analysis (EDA) (Weeks 4-5)
• Descriptive statistics (mean, median, variance)
• Customer segmentation analysis
• Product performance and sales data analysis
• Funnel analysis: Awareness to conversion
• Hands-on with Pivot Tables, VLOOKUP, IF statements in Excel -
04
Data Visualization & Dashboards (Weeks 6-7)
• Introduction to Tableau and Google Looker Studio
• Creating charts, graphs, and maps
• Building interactive marketing dashboards
• Custom filters and calculated fields
• Data storytelling: Presenting insights effectively -
05
Campaign Performance Analysis (Weeks 8-9)
• Analyzing performance across Google Ads, Facebook, Instagram
• Attribution modeling: First-touch, last-touch, and multi-touch models
• A/B testing analysis: Interpreting results
• Campaign ROI breakdown and optimization insights
-
06
Advanced Analytics Techniques (Weeks 10-11)
• Predictive modeling: Forecasting sales and revenue
• Customer lifetime value (CLV) calculation
• Cohort analysis for tracking user behavior over time
• Market basket analysis for cross-selling opportunities -
07
Google Looker Studio Deep Dive (Week 12)
• Connecting Looker Studio to Google Analytics, Facebook Ads, and YouTube
• Creating interactive dashboards for campaign performance
• Blending multiple data sources into one report
• Building automated reporting templates for clients -
08
Web Analytics & SEO Tracking (Weeks 13-14)
• Google Analytics setup & advanced tracking
• Understanding website traffic, sources, and user behavior
• Tracking SEO performance metrics (organic traffic, keywords, bounce rates)
• Using Google Search Console for SEO analysis -
09
E-commerce Analytics (Weeks 15-16)
• Tracking sales, product performance, and conversion rates
• Understanding cart abandonment and funnel drop-offs
• Analyzing customer behavior on platforms like Shopify, WooCommerce
• Customer segmentation for upselling and retention strategies
Tools & Platforms You’ll Master in Marketing Analytics & Data Visualization Course in Ludhiana
Essential Tools & Industry-Standard Platforms for Marketing Analytics & Data Visualization


Post Course Support for Marketing Analytics & Data Visualization Course in Ludhiana
Career Development & After Course Support Services
Build a Strong Portfolio to Showcase Your Expertise
Create a job-ready digital marketing portfolio
Gain hands-on experience with AI-driven marketing tools
Resume Building & Global Job Application Support
Learn AI-powered resume-building techniques
Prepare for job interviews with expert guidance
Mentorship & Career Guidance for Choosing Your Growth Path
Start freelancing & earn as a digital marketing expert
Get mentorship to launch & scale your own digital business
Career Opportunities After Digital Marketing Course
You can explore various career opportunities, including:
Frequently Asked Questions
This course teaches you how to analyze marketing data using AI-powered tools like Excel, Tableau, and Looker Studio for better business decisions.
Our Ludhiana-based course includes hands-on projects, AI tools, and personalized mentorship to help professionals gain practical marketing analytics skills.
You’ll master Excel for analytics, Tableau for dashboards, and Looker Studio for marketing data reporting — all integrated with AI.
Students, business owners, marketing executives, and aspiring analysts who want to upskill in marketing data and visualization can join.
Yes, you will earn a certification from Aadvi Business Structures, validating your expertise in AI-powered analytics and visualization.
You can apply for roles like Marketing Data Analyst, Business Intelligence Executive, Performance Analyst, or Visualization Specialist.